Opening the Data Analyst's Toolkit: An Introduction to Essential Tools i.e excel, power bi, tableau

Posted On: 2025-March-15
3 Minutes Read
Author: jack frost
So, you understand that data holds valuable insights and analytics is the key to unlocking them. But how do people actually do that? It's not just about staring at numbers; analysts use a variety of powerful tools to collect, clean, analyze, visualize, and report on data.
Think of it like a craftsperson's workshop. You wouldn't use a hammer for every job, right? Similarly, data analysts have a range of tools, each suited for different tasks and levels of complexity. Let's peek inside this toolkit, starting with the most accessible and moving towards the more specialized.
(As of Wednesday, April 9, 2025, these categories and tools remain central to the field)
1. The Foundation: Spreadsheets (Excel, Google Sheets)
Chances are, you've used these before! Spreadsheets are often the very first tool aspiring analysts encounter, and for good reason.
- What they do: Allow you to enter data manually or import it, perform calculations using formulas, sort and filter information, and create basic charts and graphs.
- Why they're great for beginners: They are familiar, relatively easy to learn, and excellent for handling smaller datasets and performing quick analyses.
- Think of them for: Organizing simple data, basic calculations, creating simple bar or pie charts, initial data exploration.
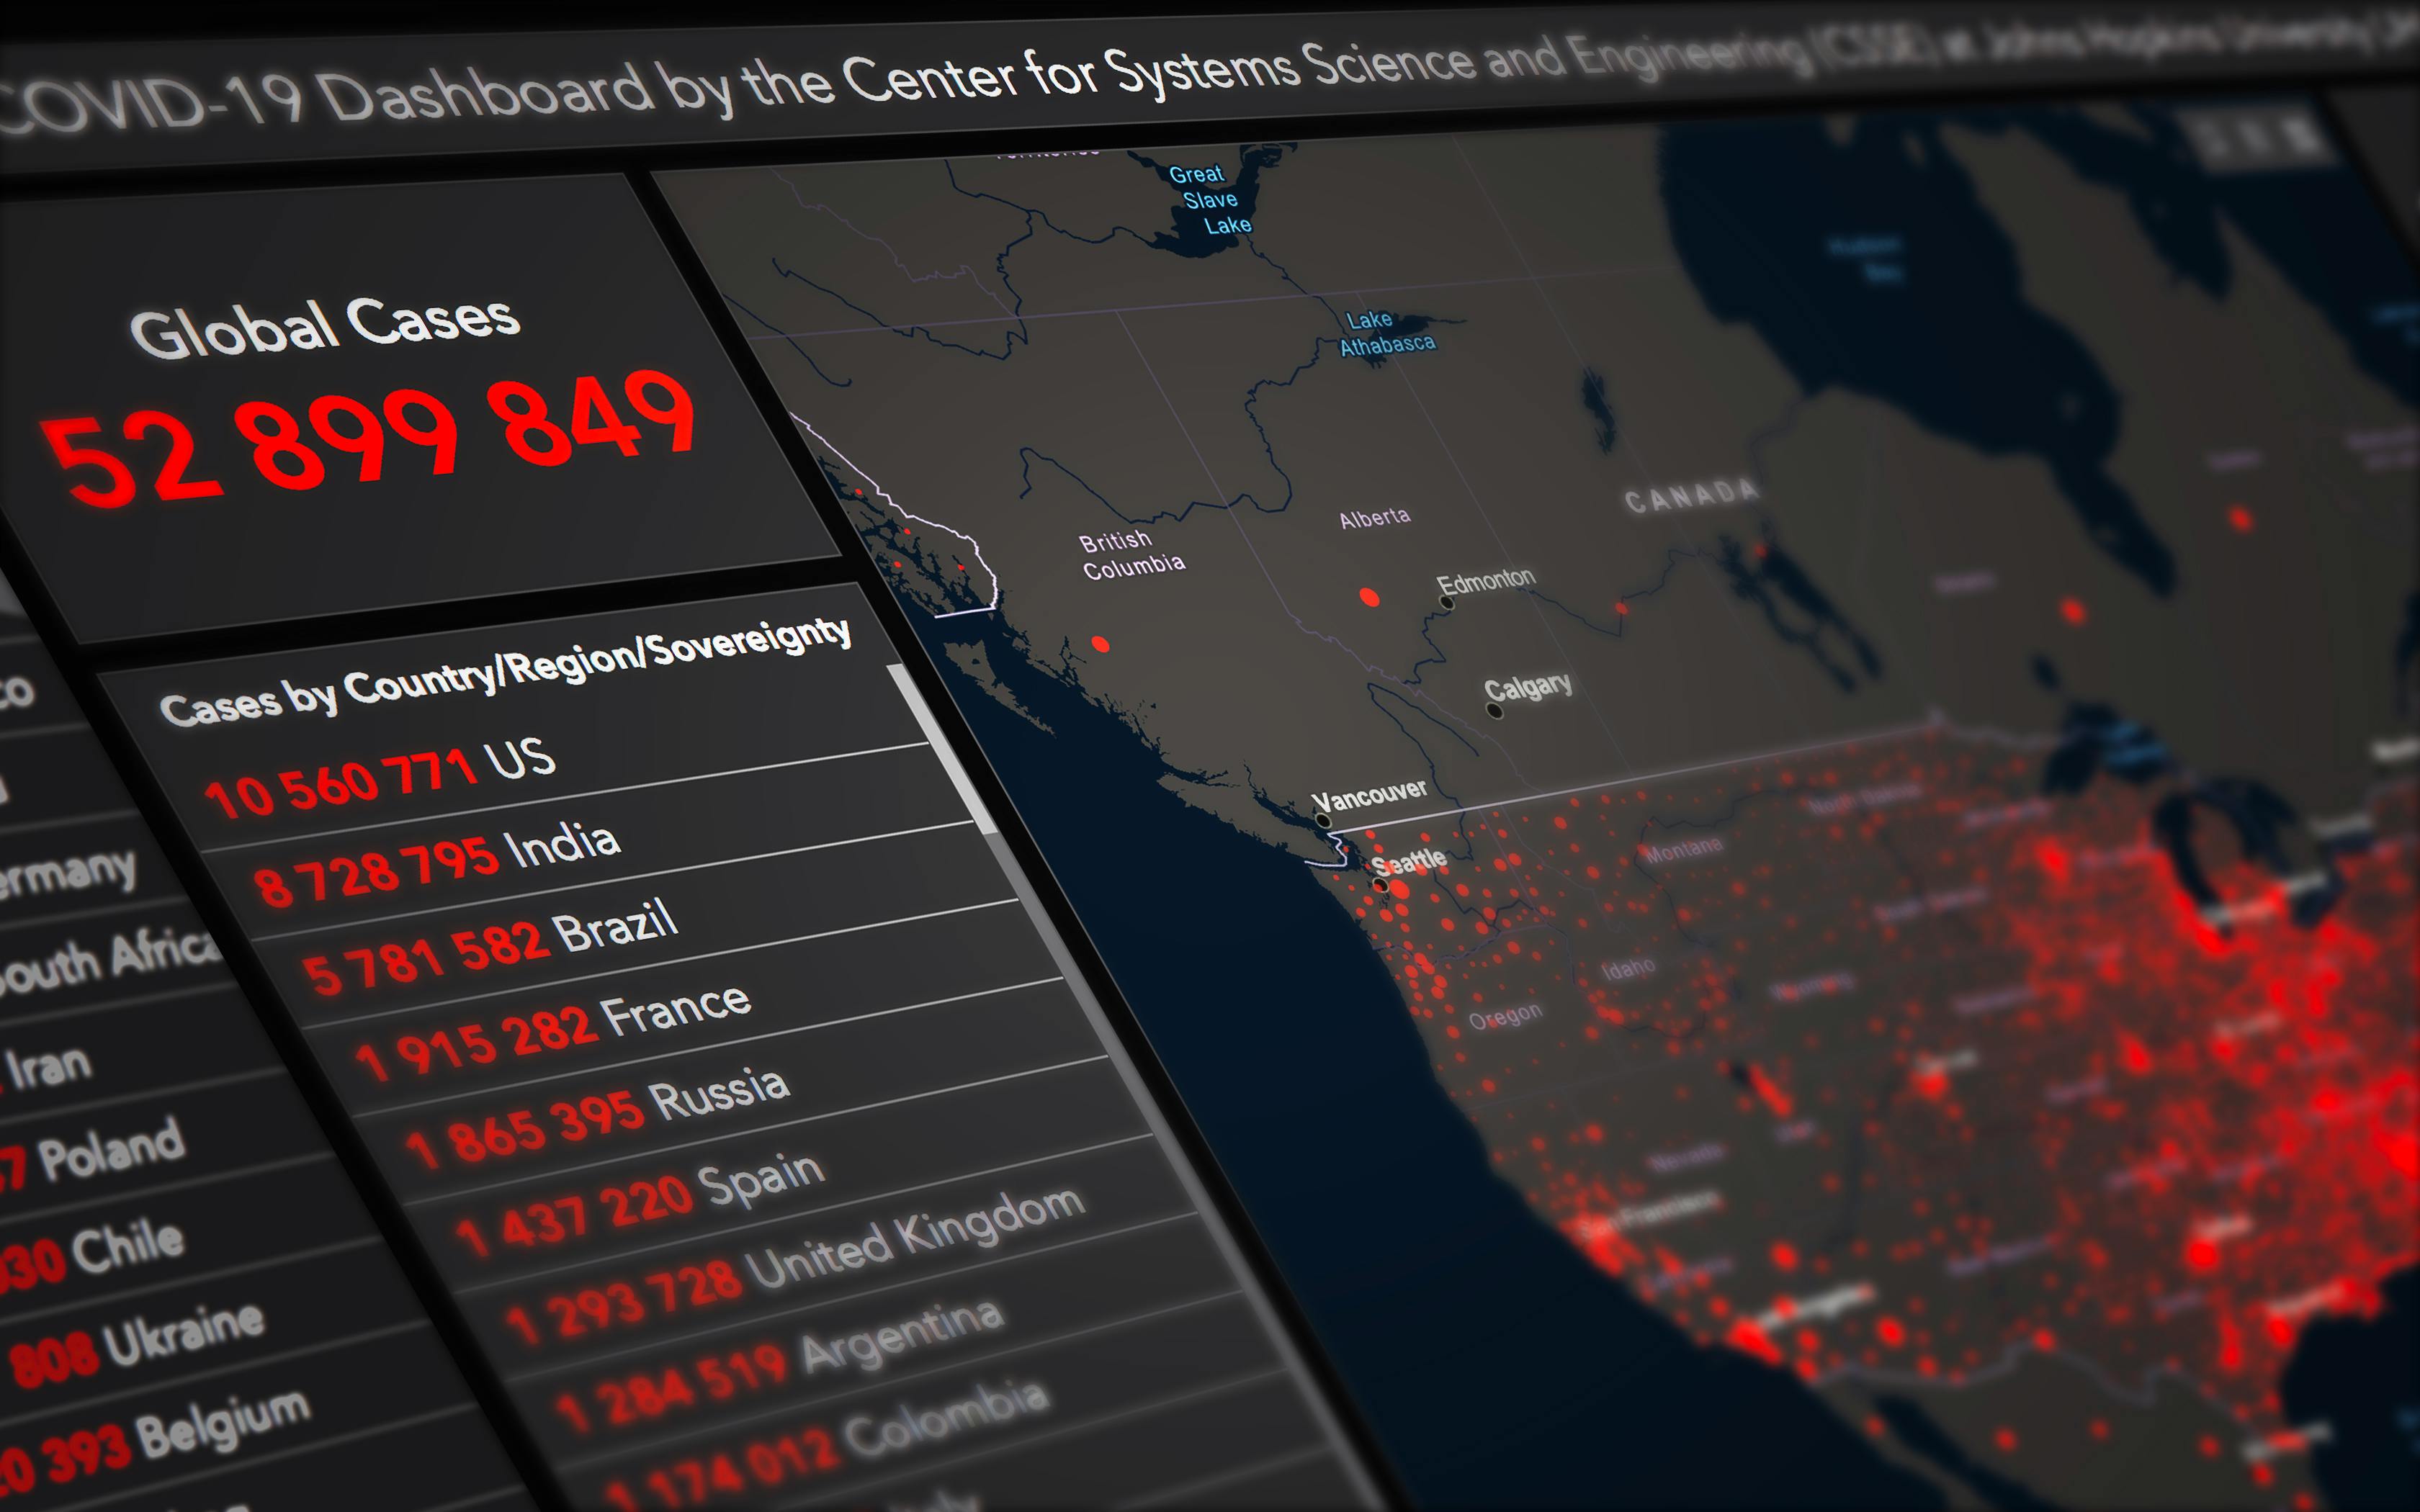
2. Seeing the Story: Business Intelligence (BI) & Visualization Tools (Tableau, Power BI, Google Looker Studio)
When you need to explore data visually and create interactive reports or dashboards, BI tools are the next step up.
- What they do: Connect to various data sources (spreadsheets, databases, etc.), allow users to create interactive charts, maps, and graphs often via drag-and-drop interfaces, and build shareable dashboards that update automatically.
- Why they're powerful: They make complex data understandable through visualization. You can spot trends, outliers, and patterns much faster than looking at raw numbers. They are designed for exploration and communication.
- Think of them for: Creating dynamic dashboards for business reporting, exploring relationships in data visually, sharing insights with non-technical audiences.
3. The Powerhouses: Programming Languages (Python & R)
For deeper analysis, handling larger datasets, automating tasks, and employing advanced statistical techniques or machine learning, programming languages are essential.
- Python: Extremely versatile and widely popular. With libraries like Pandas (data manipulation), NumPy (numerical operations), Matplotlib and Seaborn (visualization), and Scikit-learn (machine learning), it's a complete analytics workbench.
- R: Built by statisticians for statisticians. It excels at complex statistical analysis and visualization (especially with packages like dplyr for manipulation and ggplot2 for graphics).
- Why they're essential for serious analysis: Offer unmatched flexibility, can handle massive datasets, allow for complex custom analyses, automate repetitive tasks, and are the foundation for data science and machine learning. There's a steeper learning curve, but the payoff is huge.
- Think of them for: Complex data cleaning and transformation, statistical modeling, machine learning, automating analysis pipelines, handling very large datasets.
4. Talking to Databases: SQL (Structured Query Language)
Most business data doesn't live in spreadsheets; it lives in databases. SQL is the standard language used to communicate with these databases.
- What it does: Allows you to retrieve specific data from relational databases. You write queries (questions) to select, filter, join, and aggregate data stored in tables.
- Why it's crucial: Even if you use BI tools or Python/R, you often need SQL to get the raw data first. It's a fundamental skill for accessing organizational data.
- Think of it for: Pulling specific customer information, extracting sales data for a particular period, joining data from different tables within a database.
5. Handling the Giants: Big Data Platforms (Brief Mention - Spark, Hadoop)
When datasets become truly massive (think terabytes or petabytes – way beyond what fits on a single computer), specialized tools are needed. Platforms like Apache Spark and Hadoop provide frameworks for distributing data and processing across many computers simultaneously. These are more advanced but good to be aware of.
Which Tool Should You Learn?
It depends on your goals and the task at hand!
- Starting Out: Get comfortable with Spreadsheets.
- Visualizing & Reporting: Explore a BI Tool like Tableau Public (free version) or Power BI Desktop (free).
- Accessing Data: Learning basic SQL is almost always a valuable investment.
- Deeper Analysis & Data Science: Pick up Python (often recommended for its versatility) or R (if statistically focused).
Conclusion
The world of data analytics tools is vast, ranging from everyday spreadsheets to sophisticated programming environments. Don't feel you need to master them all at once! Start with the basics, understand what each type of tool is best for, and gradually expand your toolkit as your needs and skills grow. The most important thing is choosing the right tool to effectively turn raw data into meaningful insights. Happy analyzing!